The Lourdes Gutierrez Group

Market Report

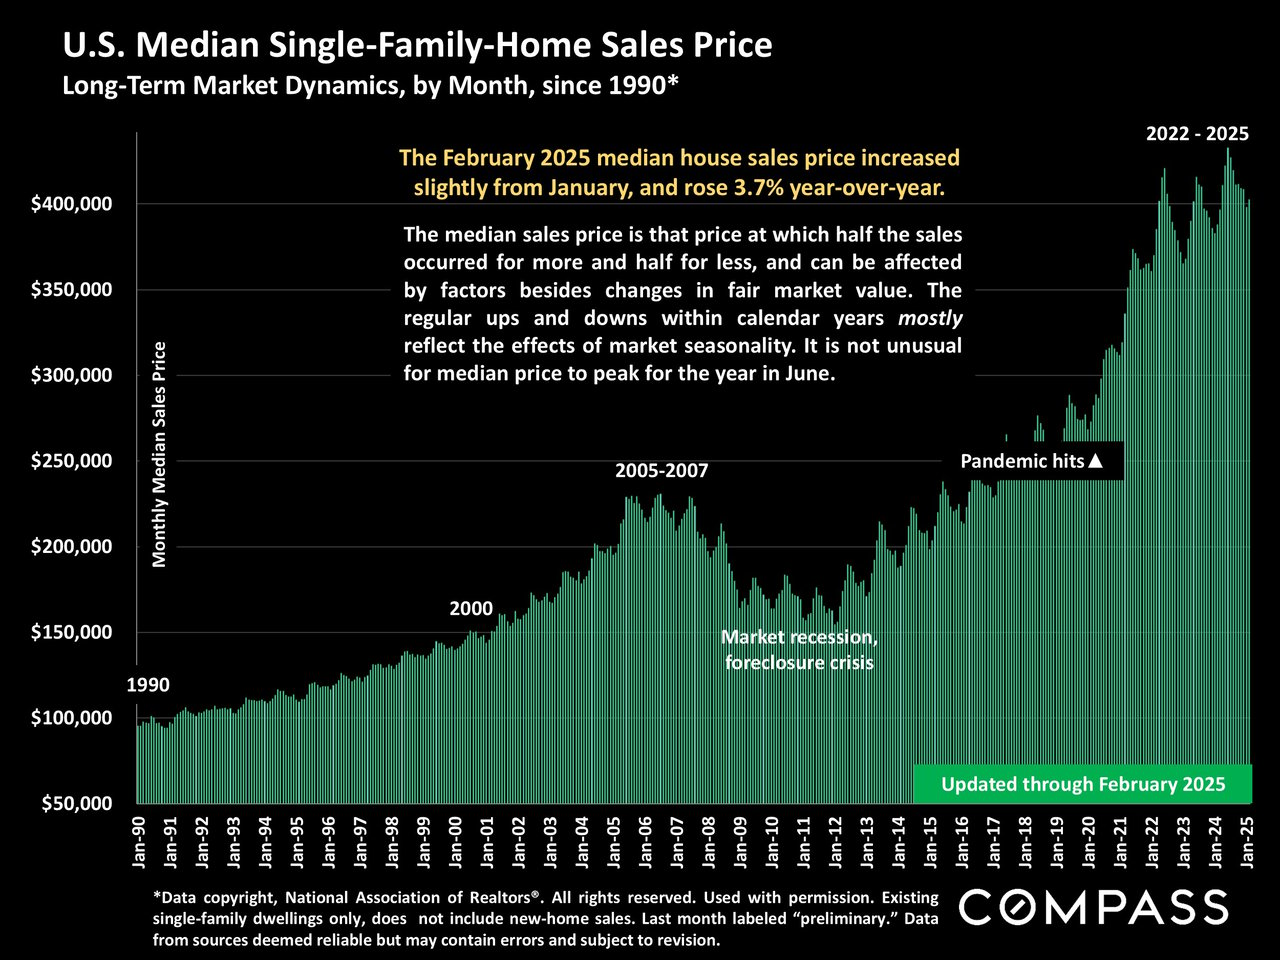
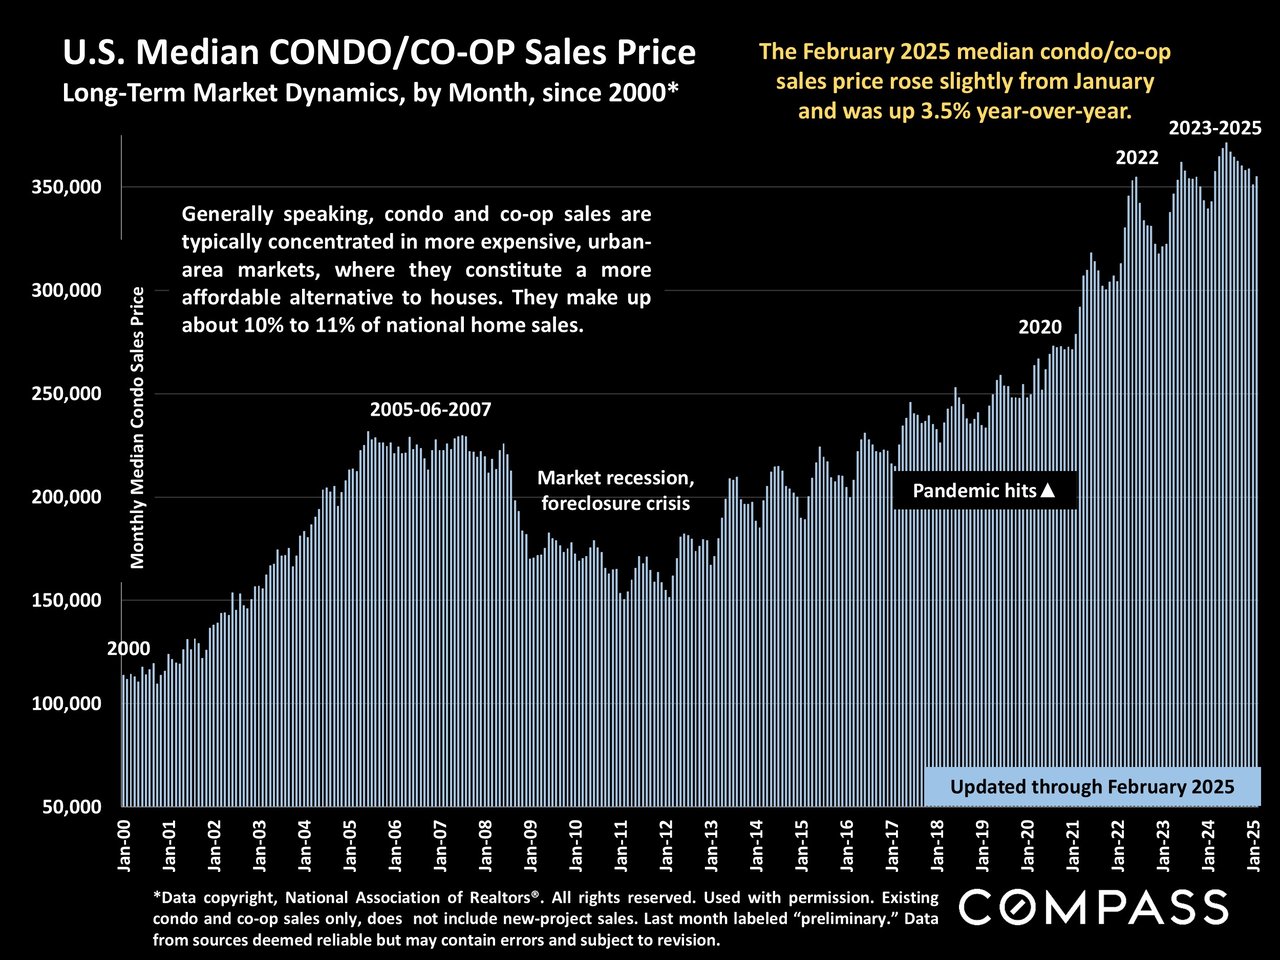
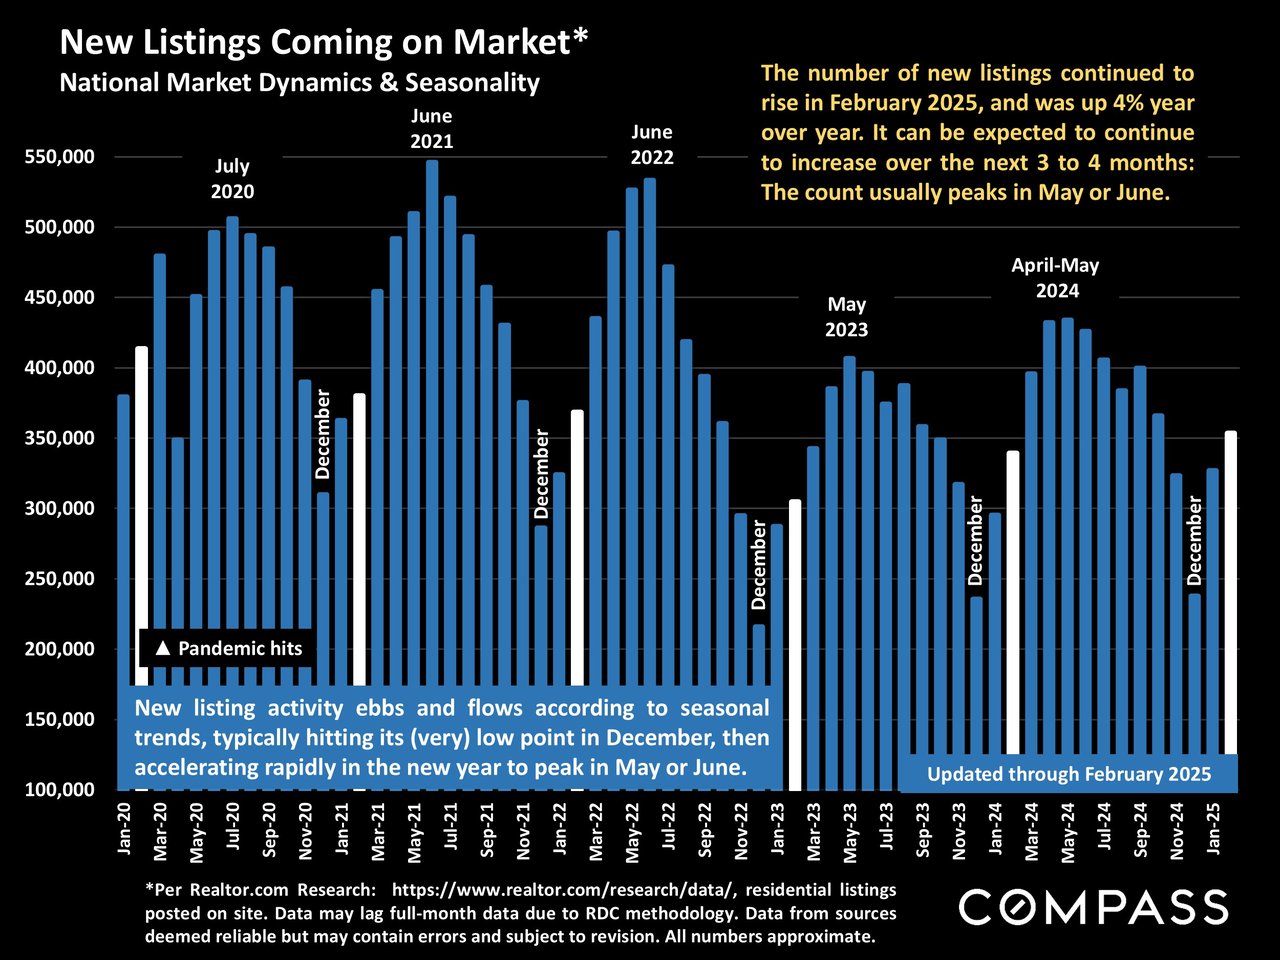
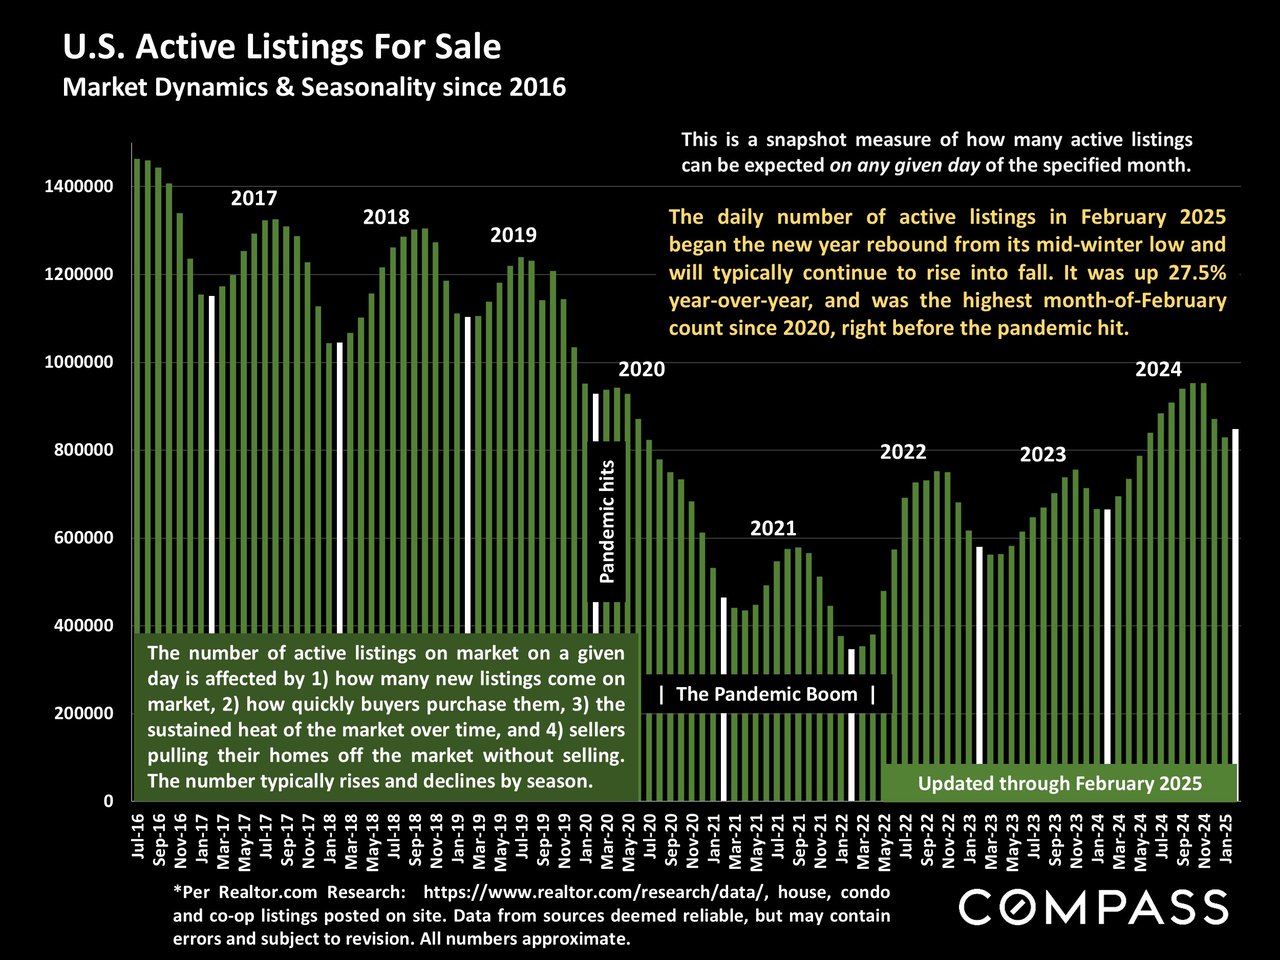
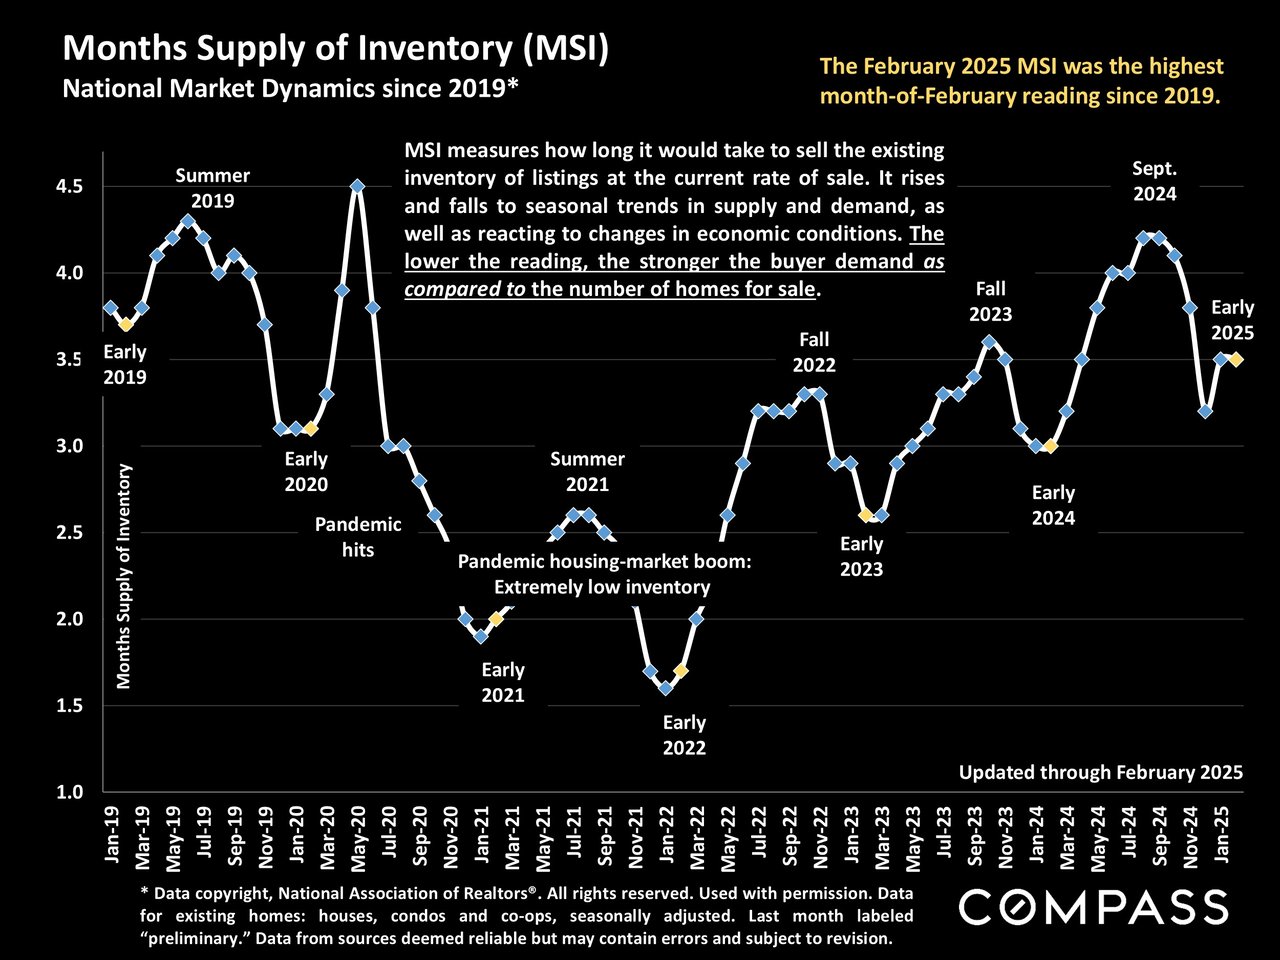
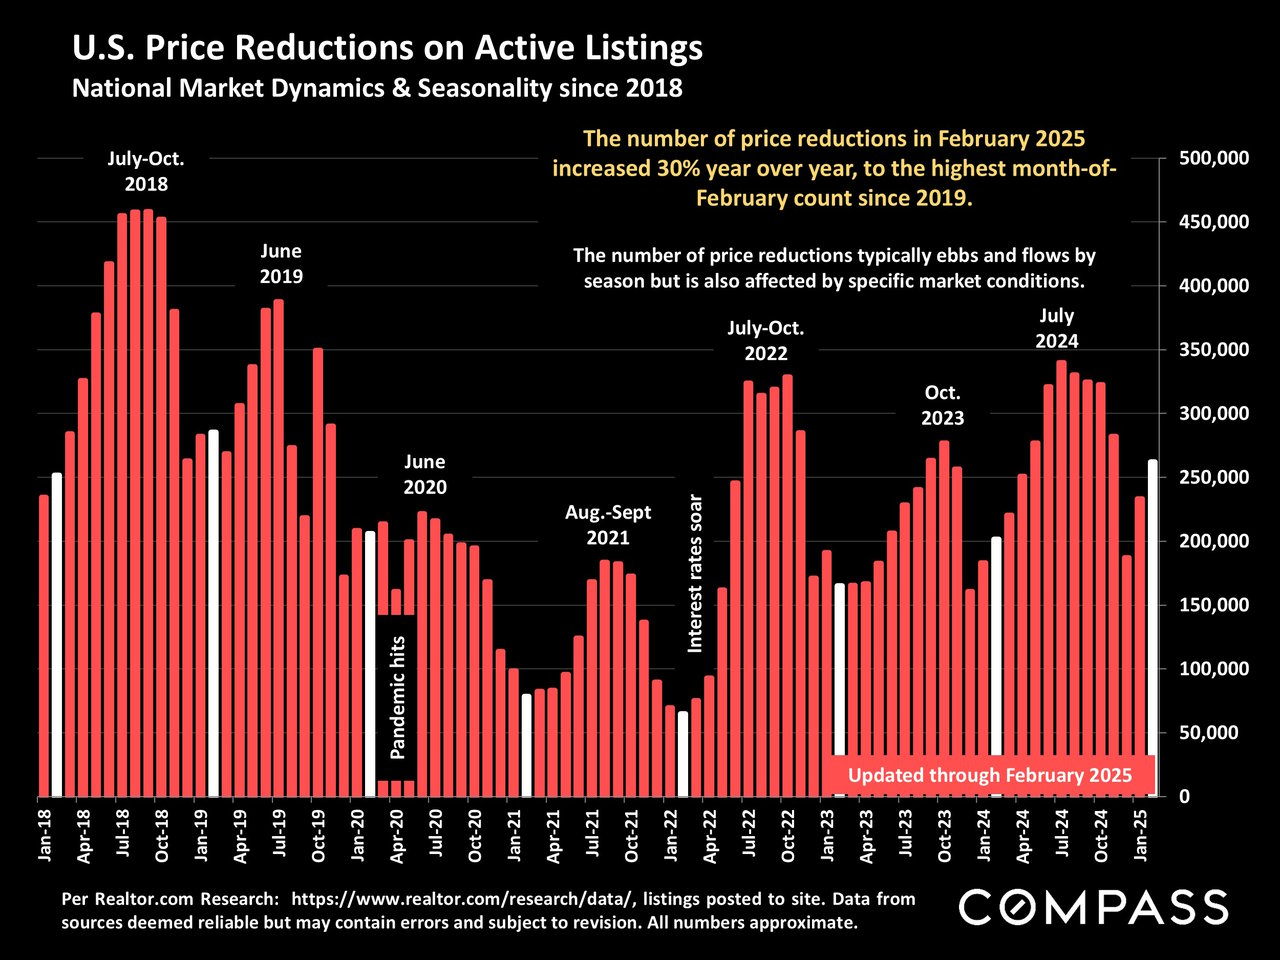
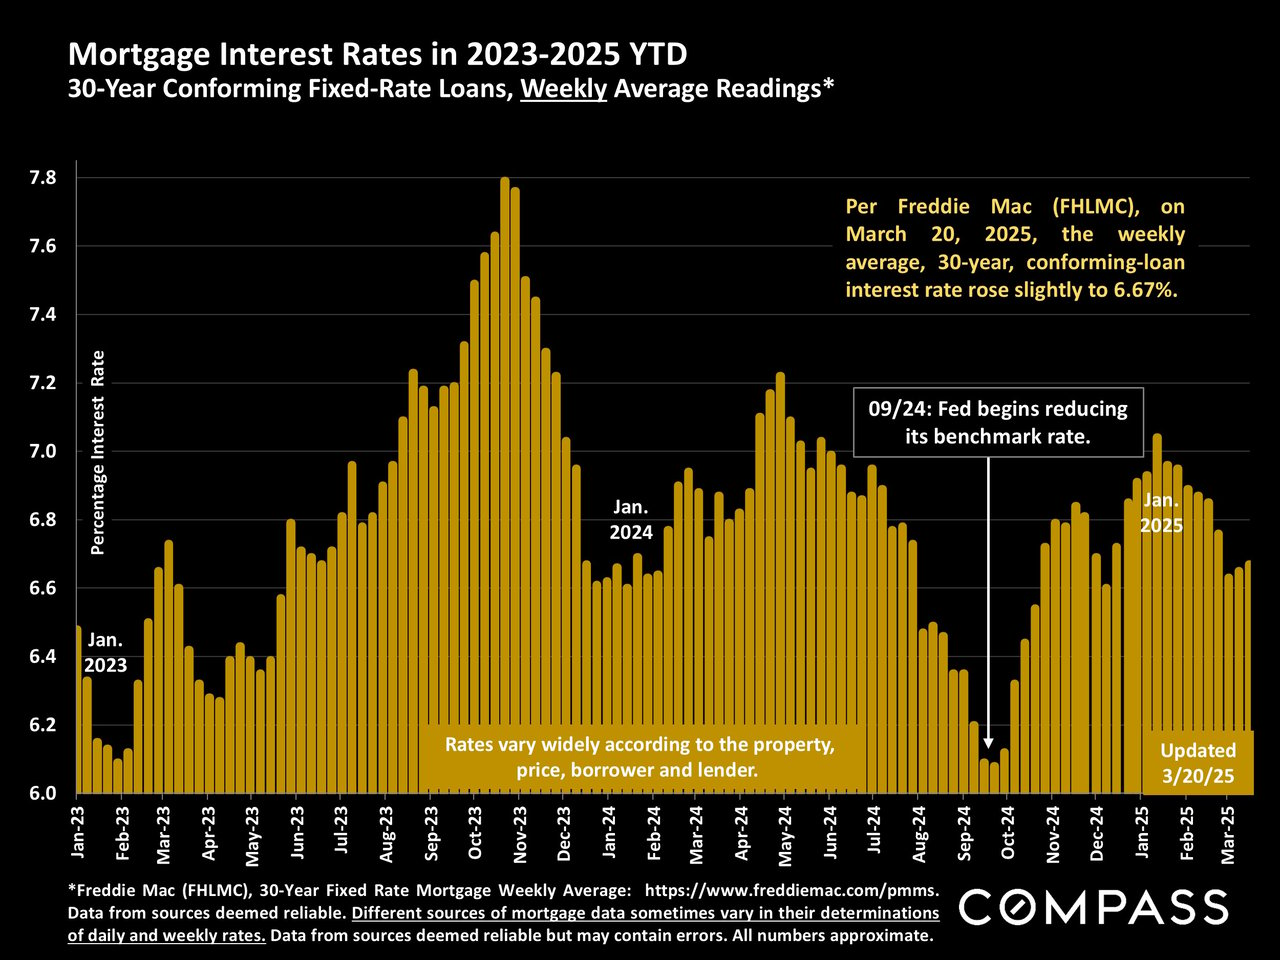
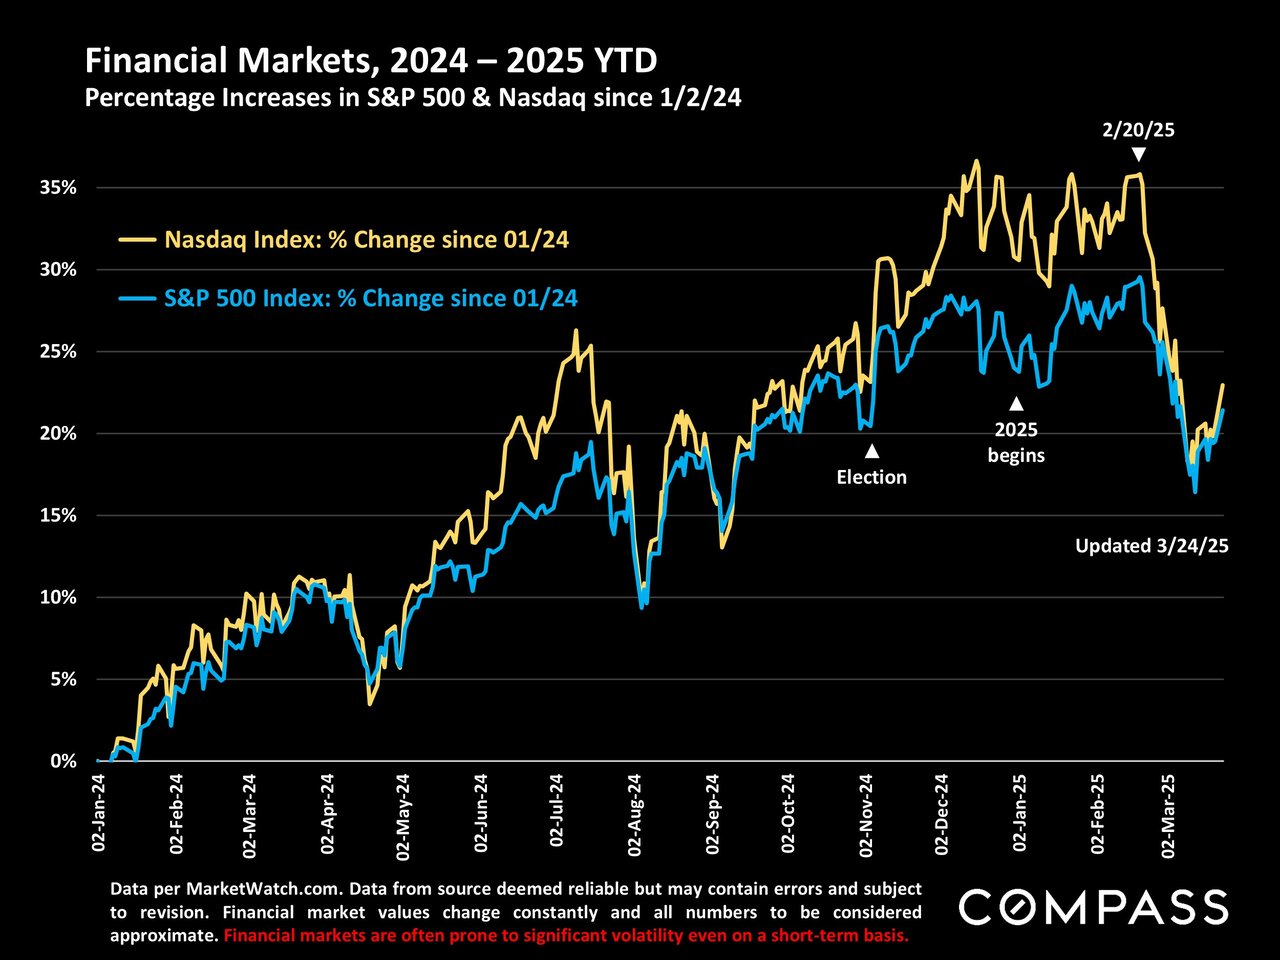
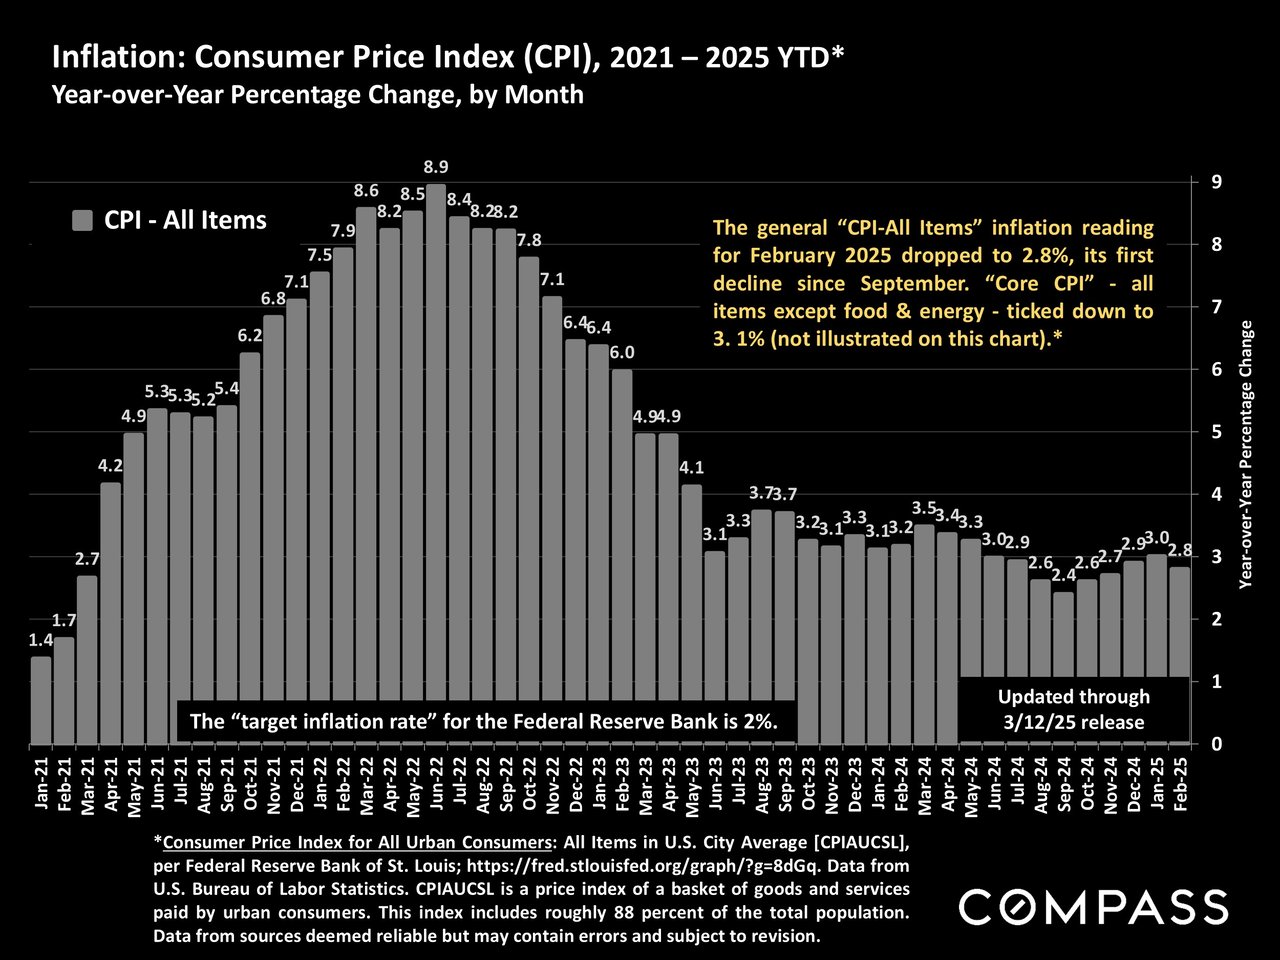
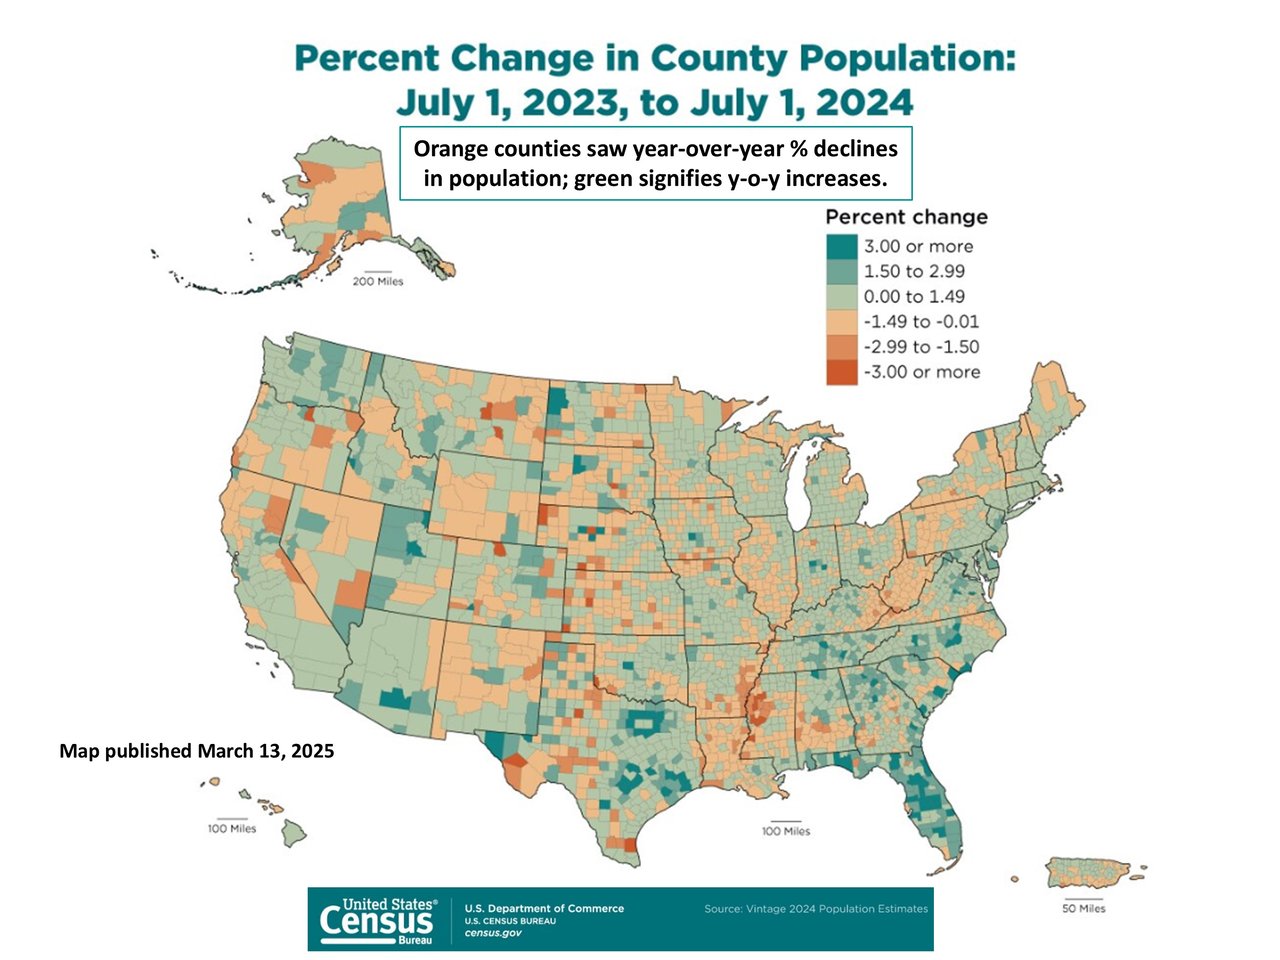
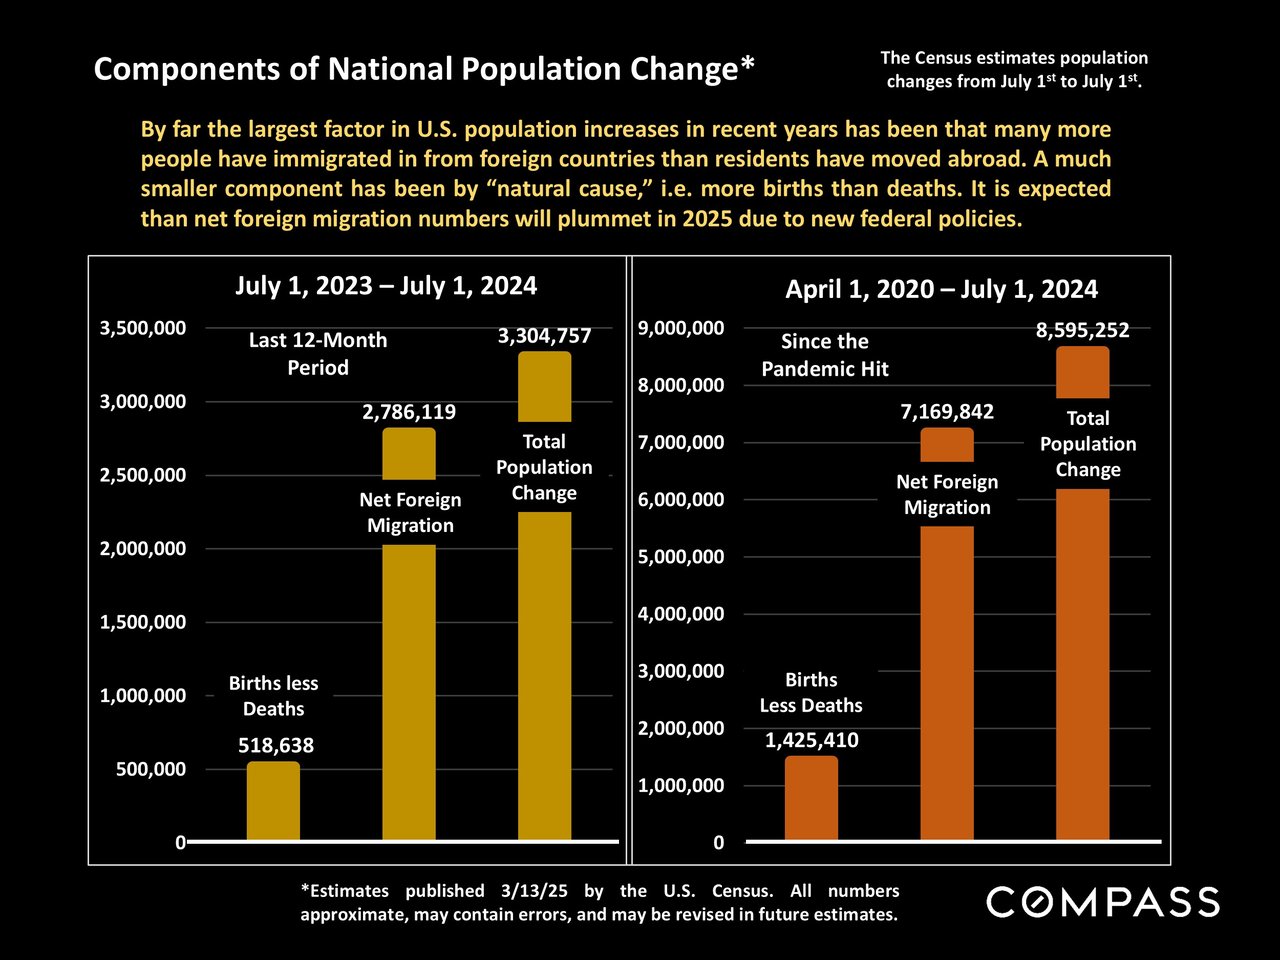
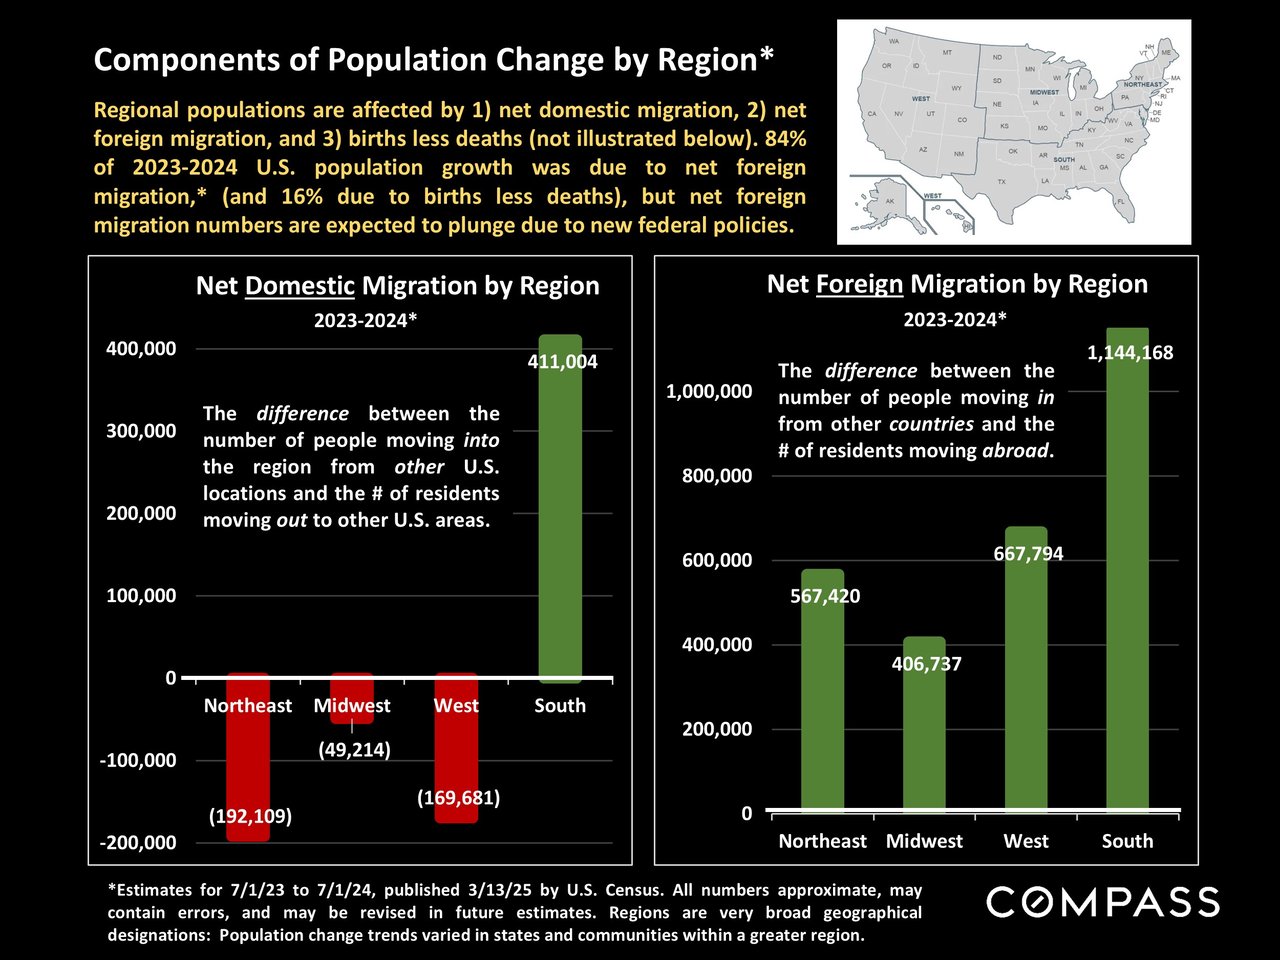
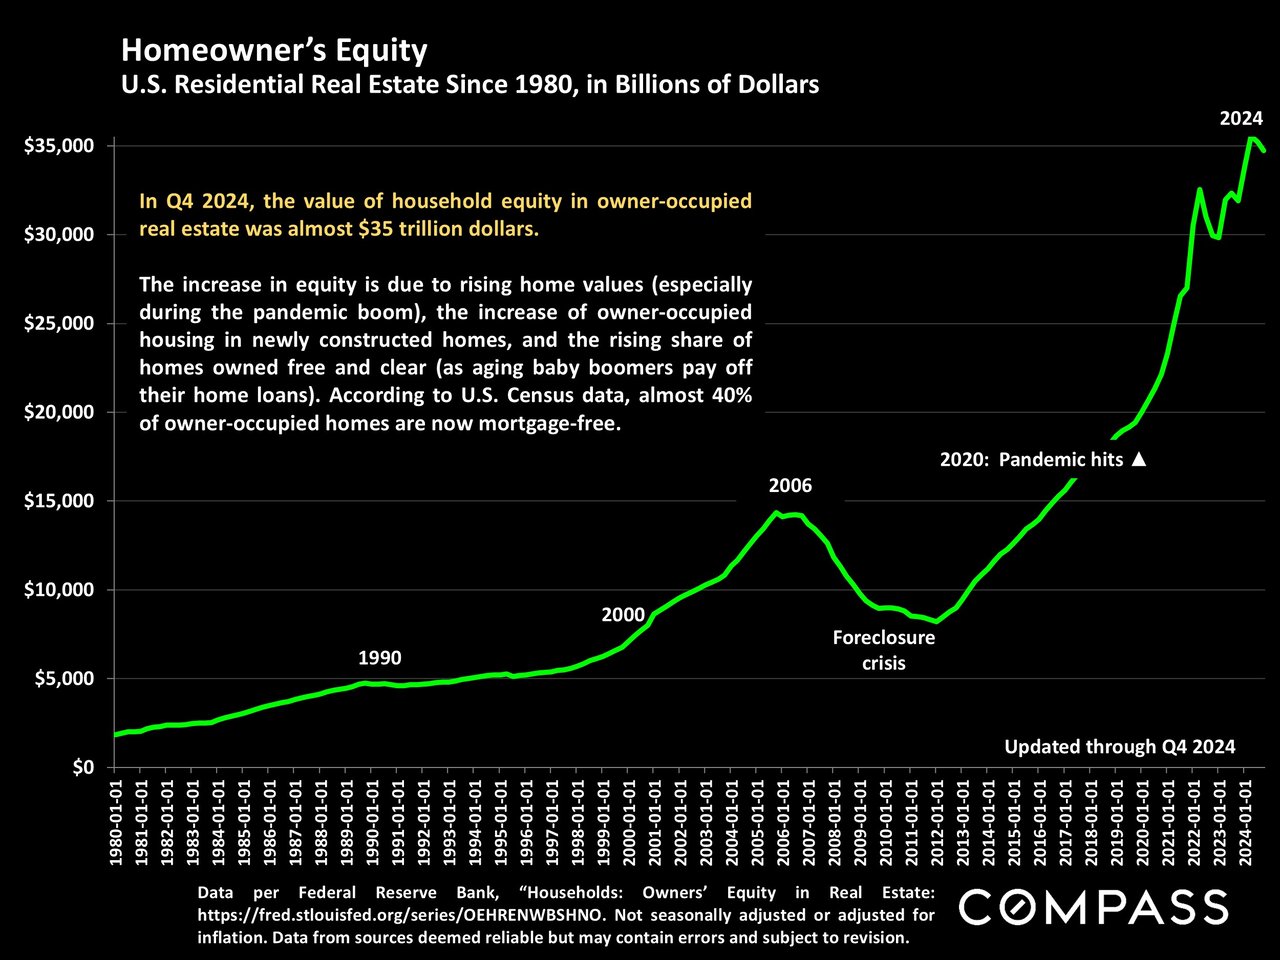
Compass National Real Estate Insights 2025 cover with red-and-white beach umbrellas beside turquoise water.March 2025 national real estate report summarizing February sales, prices, listings, and market trends.Chart of U.S. median single-family home sales prices, 1990–2025, showing a steep rise after 2020.Chart of U.S. median condo and co-op sales prices from 2000 through February 2025, with a sharp rise after 2020.Bar chart of U.S. new listings from 2020 to 2025, showing seasonal peaks in May or June and December lows.Bar chart of U.S. active listings for sale from July 2016 through January 2025, with pandemic-era trends.Line chart of U.S. monthly home sales from 2020 to 2025, showing seasonal peaks and winter lows.Chart of national months’ supply of housing inventory from 2019 to 2025, with a February 2025 market note.Bar chart of U.S. active-listing price reductions from January 2018 through February 2025.Chart of weekly 30-year mortgage rates from 2023 to March 2025, ending at 6.67%.Line chart comparing Nasdaq and S&P 500 percentage gains from January 2024 to March 2025.Bar chart of monthly U.S. CPI inflation, peaking at 8.9% in June 2022 and falling to 2.8% by February 2025.Map of county population percentage changes across the United States, July 2023 to July 2024.Infographic comparing U.S. population change from 2023–2024 and 2020–2024, with births, migration, and total change.Infographic comparing 2023–2024 domestic and foreign migration across four U.S. regions, with a regional map.Chart of U.S. homeowner equity rising to nearly $35 trillion by Q4 2024.